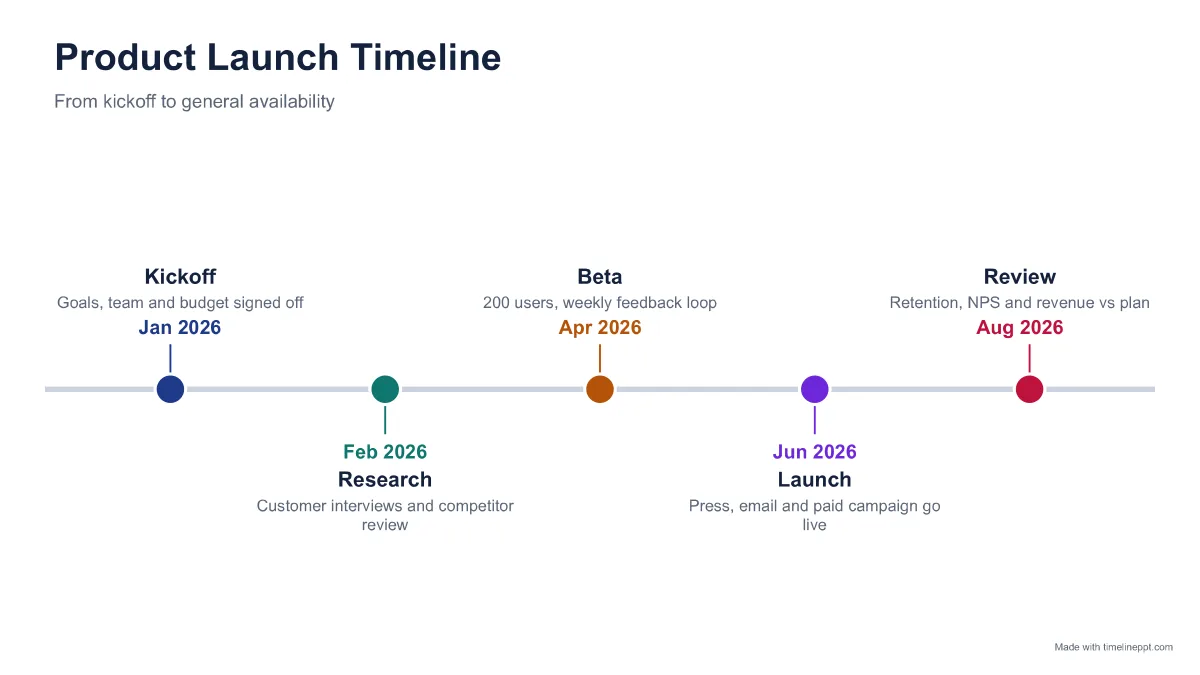
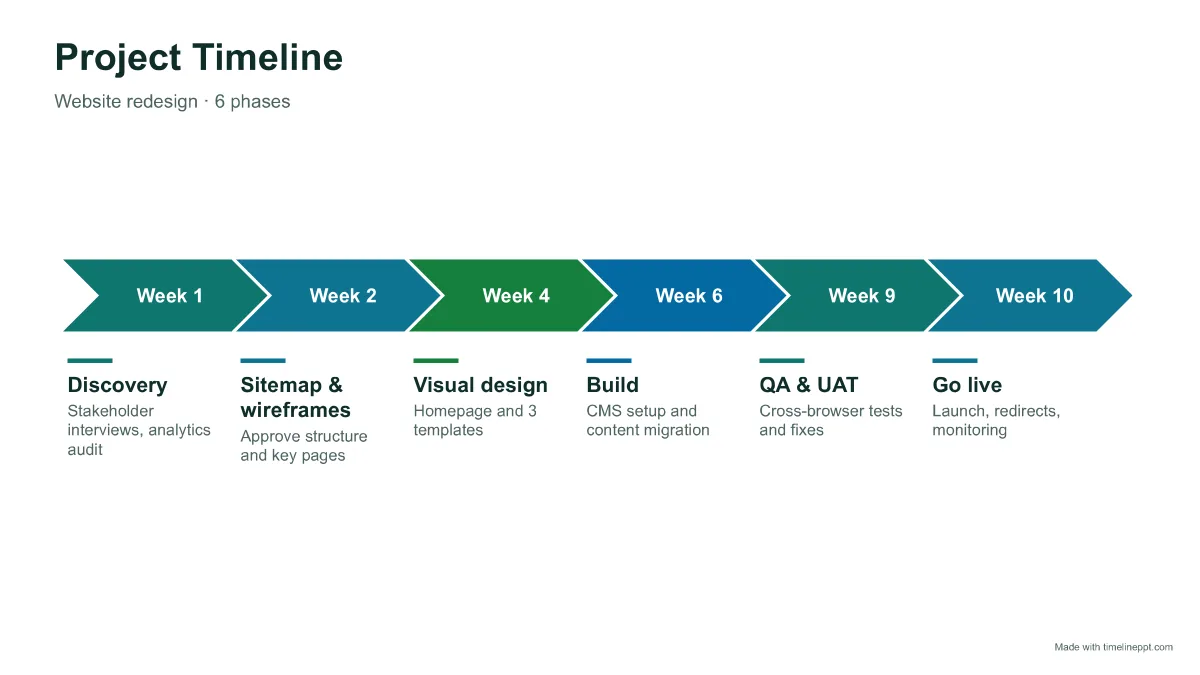
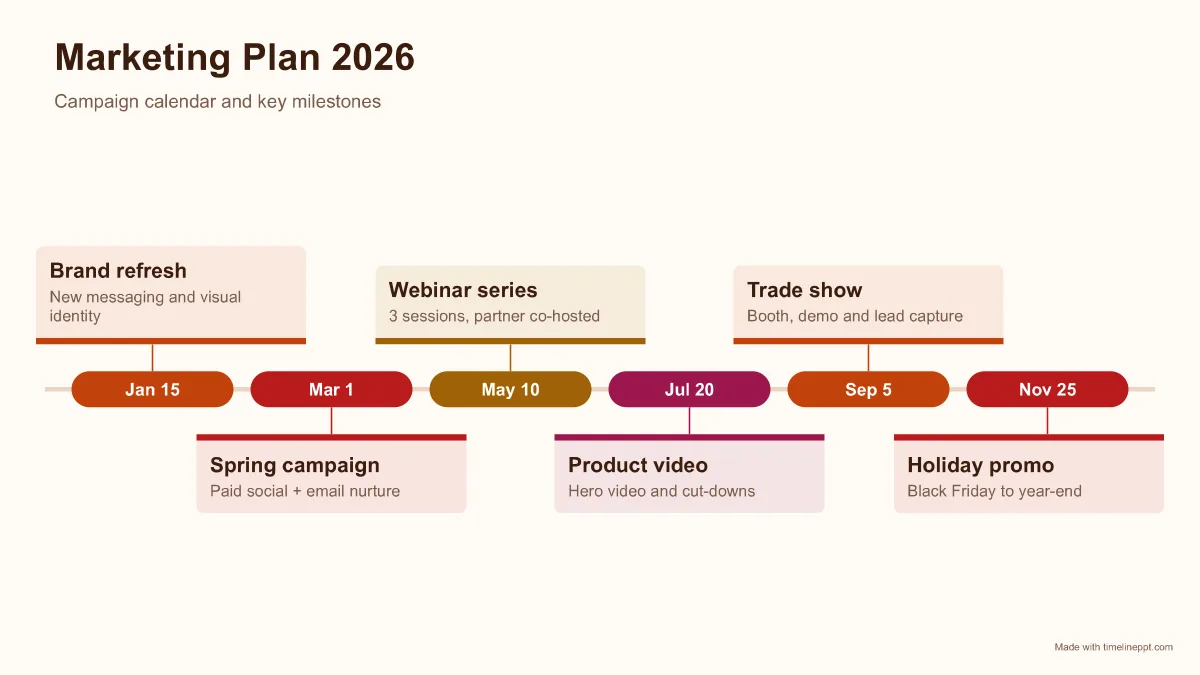
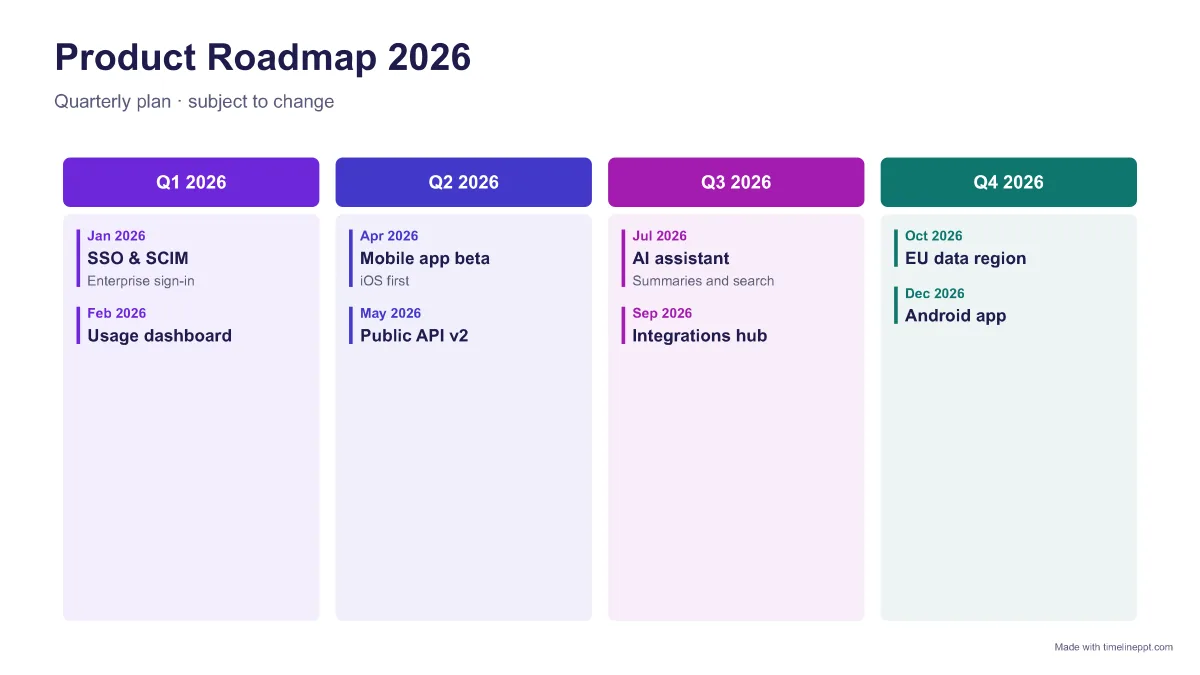
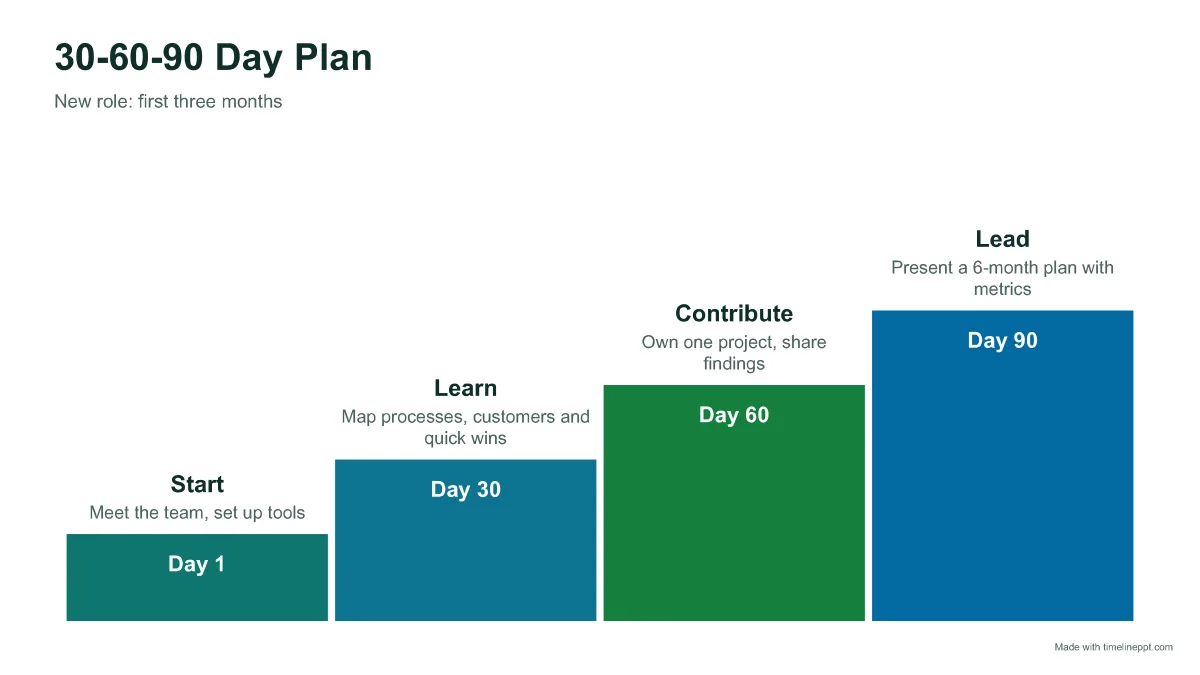
Product launch: kickoff, research, beta, launch and review across two quarters.
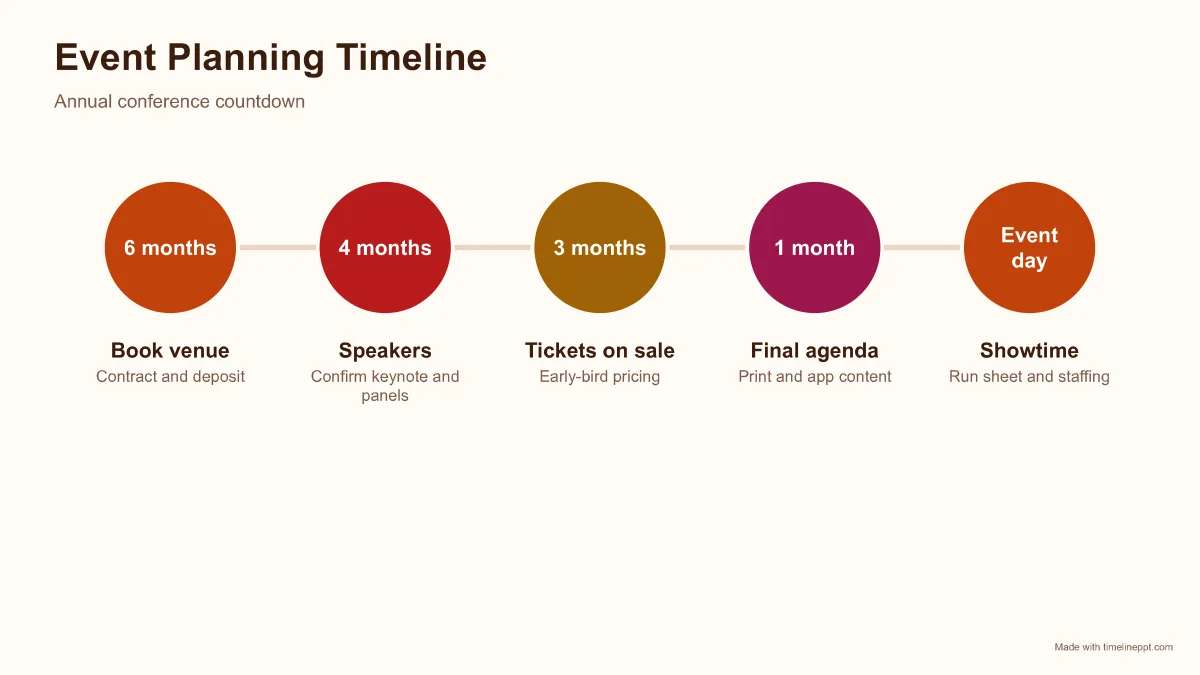
Event planning: venue, speakers, ticket sales, final agenda and event day.
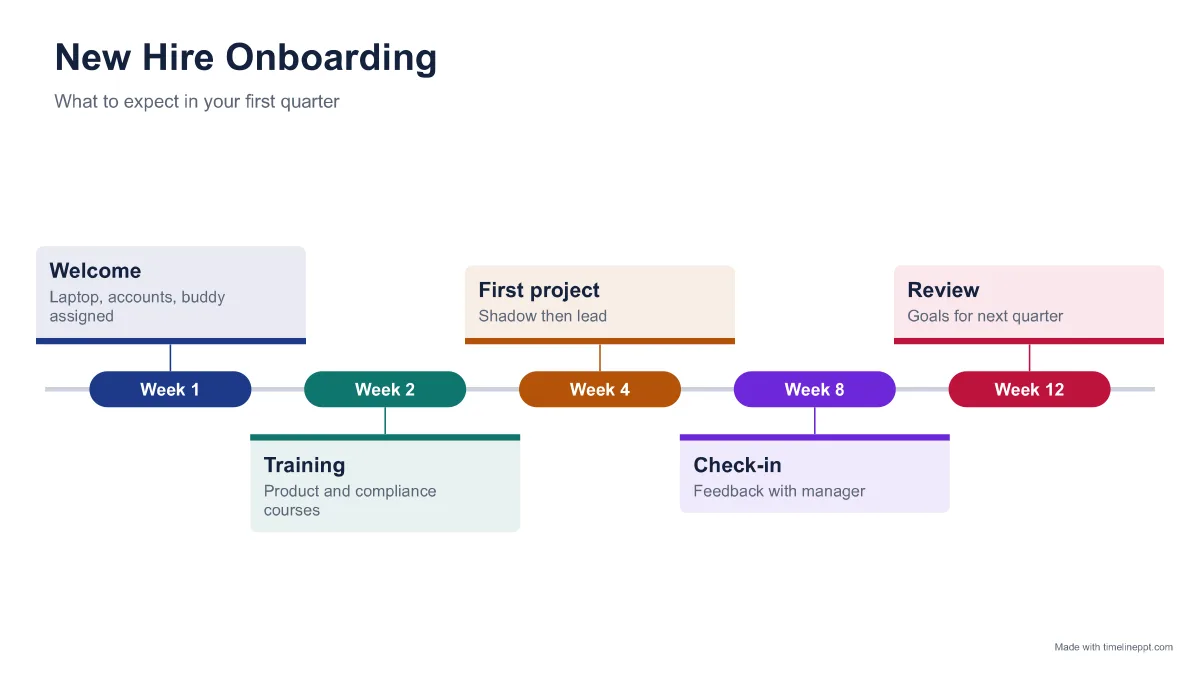
Employee onboarding: week 1 welcome through week 12 review.
Project timeline vs. Gantt chart
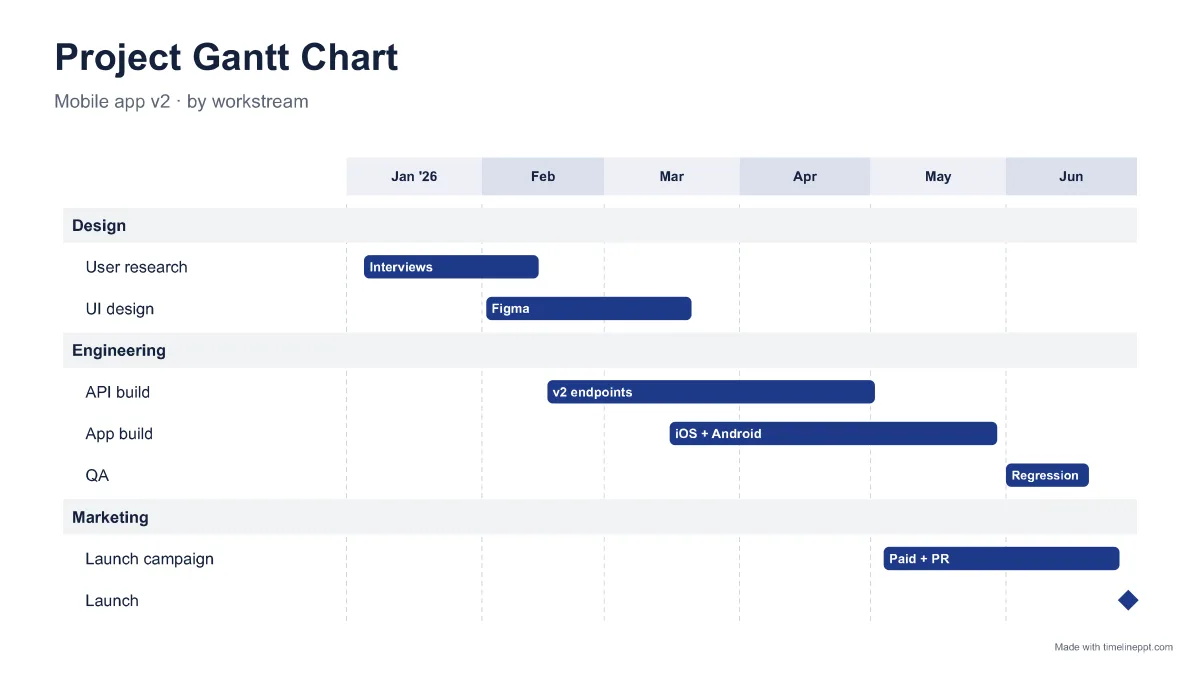
A project timeline answers “when are the big moments?”, which suits sponsors and clients. A Gantt chart answers “who is doing what, and what overlaps?”, which suits the delivery team. Many status decks use both: a timeline slide up front and a Gantt chart in the appendix. Both are available here as editable timeline PPT templates; see also roadmap templates for longer-range plans.
Common mistakes on project timeline slides
Listing every task: use phases, and link to the plan for details.
Mixing “Week 3”, “14 March” and “Q2” on one slide.
Even spacing that hides a long gap. Use “To scale” spacing when timing matters.
No status: add “On track”, “At risk” or today's phase to the subtitle.
Project timeline template FAQ
What is a project timeline template?
+
A slide that shows a project's phases and key milestones in date order, so a sponsor or client can see the plan at a glance. It is simpler than a Gantt chart: it shows when things happen, not every task and dependency.
How many milestones should a project timeline have?
+
Five to seven is ideal for one slide. Combine small tasks into phases, and keep detailed task lists in your project tool or in a Gantt chart.
Can I show week numbers instead of dates?
+
Yes. Type “Week 1”, “Week 4” and so on. You can also use “Day 30” or “Q2 2026”. With Classic, Cards and Minimal styles, To-scale spacing works with these too.
How do I make a Gantt chart in PowerPoint?
+
Choose the Gantt / swimlanes style (Pro), enter a start and end date for each task and, optionally, a team. The maker draws the time axis and bars as editable PowerPoint shapes.