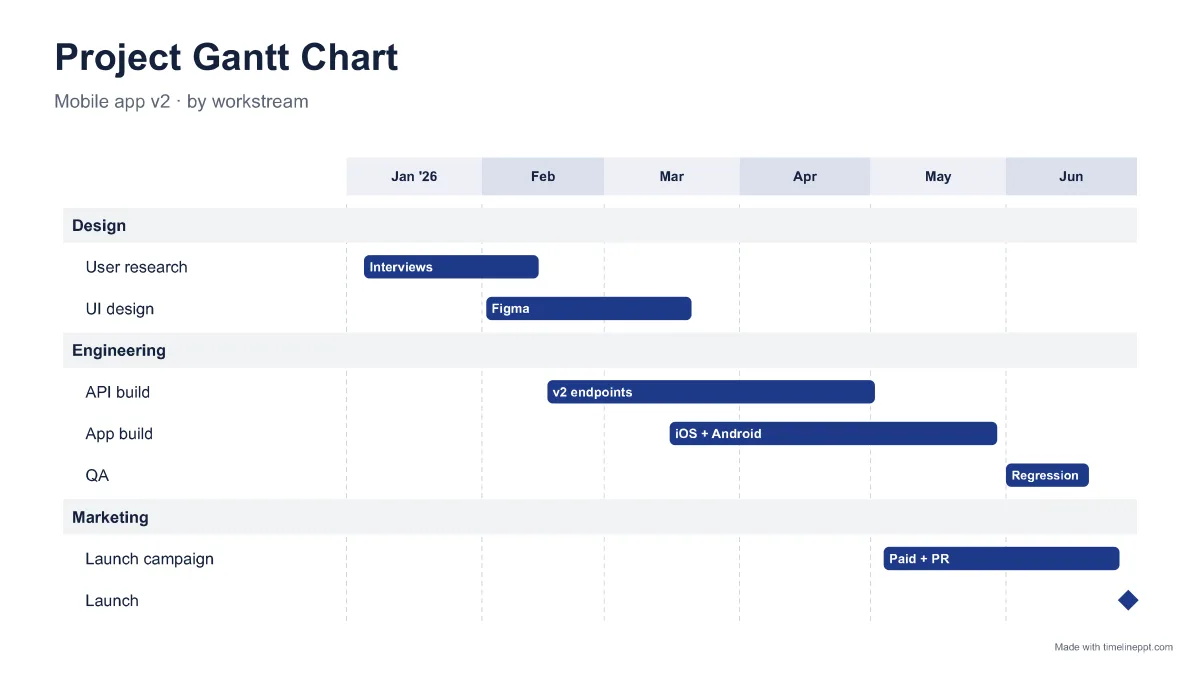
A time axis in weeks, months or quarters that matches the length of the project.
One row per task, with a bar from start date to end date.
Milestones as diamonds for single-day events like approvals or launch day.
Swimlanes that group tasks by team or workstream, so ownership is obvious.
Short task names (2-4 words), with details kept in your project tool.
How to make a Gantt chart in PowerPoint in 4 steps
List your tasks with a start and end date, or paste them from a spreadsheet.
Add a team or phase to each task to create swimlanes.
Pick the Gantt / swimlanes style. The maker chooses weeks, months or quarters for the axis automatically.
Download the .pptx and present it, or keep editing shapes in PowerPoint.
Gantt chart vs. project timeline
Question
Gantt chart
Project timeline
Shows task duration?
Yes
No, just dates
Shows overlaps and owners?
Yes, with swimlanes
Rarely
Best audience
Project team, PMO
Executives, clients
Ideal size
5-30 tasks
4-8 milestones
Many status decks use both: a project timeline up front for the big picture, and a Gantt chart in the appendix for detail.
Tips for a readable Gantt chart slide
Keep it to one page of rows; split long plans by phase or team.
Use one colour per workstream rather than per task.
Put the date of the status update in the subtitle, e.g. “Status as of 6 Oct”.
Round dates to the week for executive audiences; exact days rarely matter on a slide.
Gantt chart template FAQ
Is the Gantt chart template free?
+
Yes. The sample Gantt chart template downloads free as an editable .pptx. Building your own Gantt chart from your tasks in the maker is part of Pro, from $79/year or a $9 7-day pass.
How do I make a Gantt chart in PowerPoint?
+
Choose the Gantt / swimlanes style, enter each task with a start date, an end date and optionally a team, then download. The time axis, bars and milestones are drawn as editable PowerPoint shapes. Manually, you would build a table for the time axis and draw a rectangle per task.
What is the difference between a Gantt chart and a timeline?
+
A timeline shows when key events happen. A Gantt chart shows how long each task takes, which tasks overlap, and who owns them. Use a timeline for executives and a Gantt chart for the delivery team.
Can I open the Gantt chart in Google Slides?
+
Yes. Upload the .pptx to Google Drive and open it with Google Slides. It uses Arial and standard shapes, so the bars stay aligned.
Can I import my Gantt tasks from Excel?
+
Yes, with Pro. Upload an .xlsx or .csv with columns such as Task, Start, End and Team. The file is read in your browser and never uploaded.